Analytics & reporting
Answers from the system of record — not a second data stack.
Finance wants MRR by plan, month over month. Ops wants an SLA dashboard. The usual answer is exporting into a BI tool where permissions, definitions, and freshness quietly drift. ObjectOS runs the same questions over the governed objects themselves — defined once as a dataset, rendered in dashboards, and assembled in a designer.
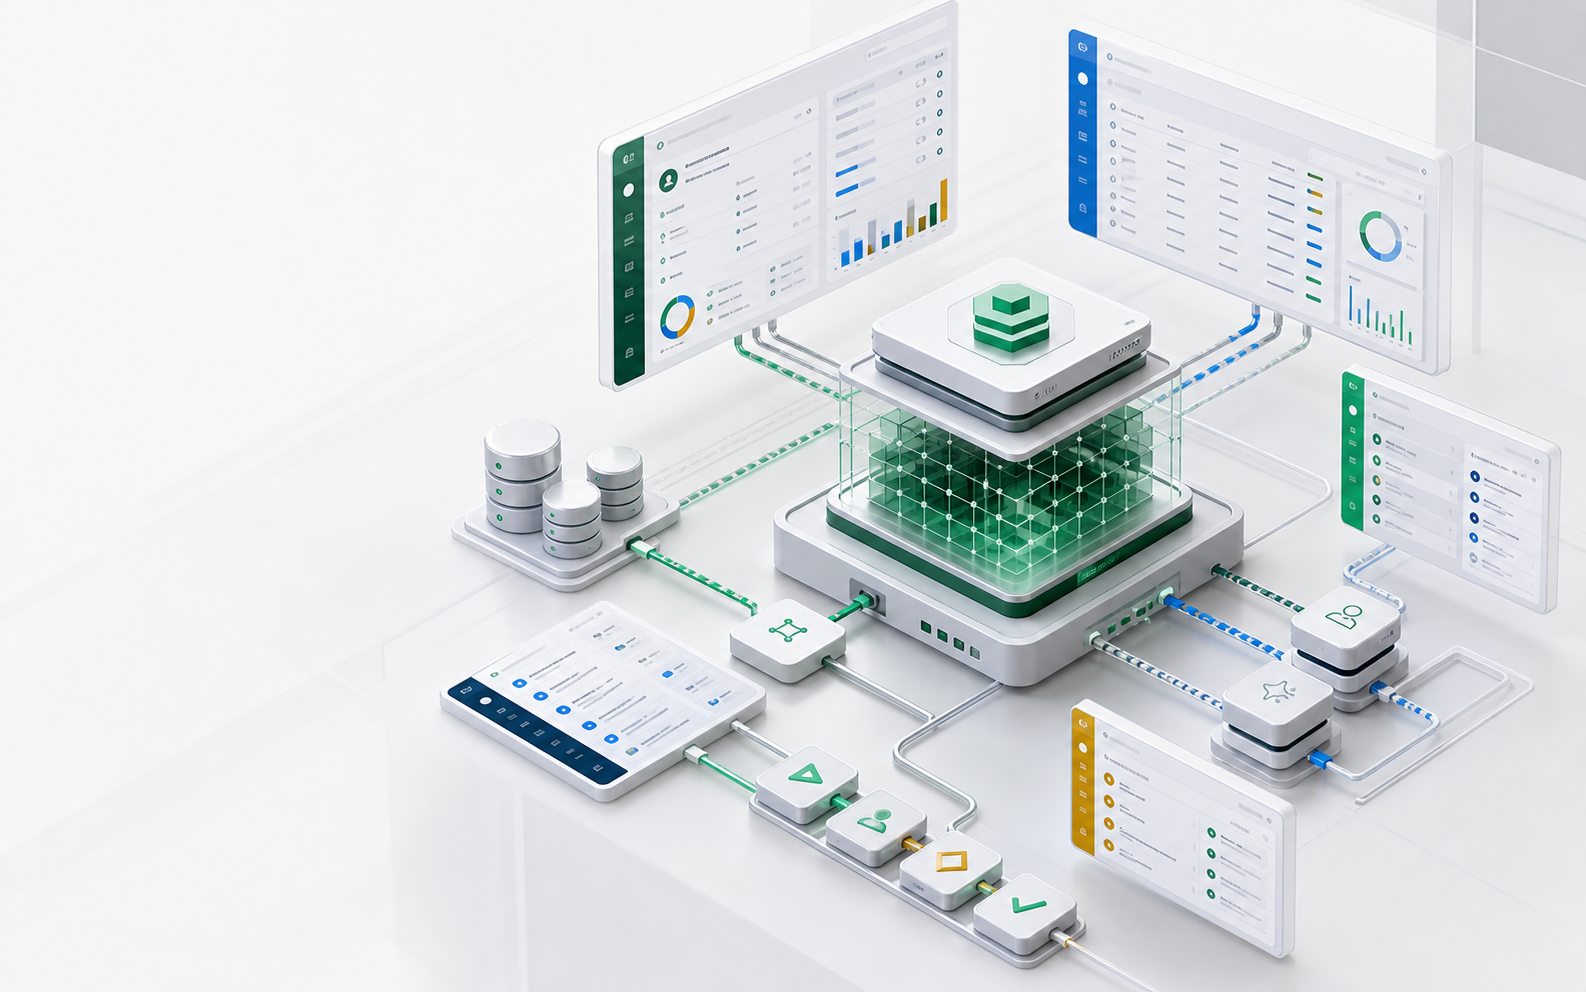
- 3
- Query strategies: native SQL, ObjectQL, in-memory
- Same rules
- Row and field permissions apply to every report
- Zero ETL
- Reports run on live objects, not exported copies
Metrics as metadata
Define the measure once. Reuse it everywhere.
A dataset names the measures and dimensions a business cares about. Dashboards, reports, and AI questions all resolve against the same definition, so "monthly recurring revenue" means one thing.
import { defineDataset, defineReport } from '@objectstack/spec/ui';

export const RevenueDataset = defineDataset({
  name: 'billing_revenue',
  label: 'Revenue',
  object: 'billing_subscription',
  dimensions: [
    { name: 'plan', label: 'Plan', field: 'plan', type: 'string' },
    { name: 'month', label: 'Month', field: 'renews_at', type: 'date', dateGranularity: 'month' },
  ],
  measures: [
    { name: 'mrr', label: 'MRR', aggregate: 'sum', field: 'mrr', format: '0.0' },
    { name: 'active_subs', label: 'Active Subscriptions', aggregate: 'count' },
  ],
});

export const MrrByPlan = defineReport({
  name: 'billing_mrr_by_plan',
  label: 'MRR by Plan',
  type: 'summary',
  drilldown: true,
  dataset: 'billing_revenue',
  rows: ['plan'],
  values: ['mrr'],
});
Reporting primitives
Answer finance’s question, then keep going
The analytics service compiles questions to the right strategy — pushed down to SQL where it can, computed in the runtime where it must.
Aggregations & grouping
“MRR by plan” is the dataset’s sum over one dimension — sums, counts, averages, and breakdowns traverse relations through the query engine.
Time series
The renewal curve by month, ticket volume by week — time-zone-aware bucketing by day, week, or month on any date dimension.
Funnels
Trial → paid, request → approved → fulfilled — stage-to-stage conversion across status fields and processes.
Dashboards
The MRR chart, the active-subscriptions counter, and the churn table compose into one shareable dashboard next to the records they summarize.
Semantic datasets
Named measures and dimensions keep every team — and every AI answer — computing the same numbers.
The dashboard & report designers
Assembled by clicking, saved as metadata
Dashboards and reports open in designers in the open-source ObjectStack console — what you click together is stored as the same reviewable definitions an agent writes.
The dashboard designer
Click a widget on the grid canvas and an inspector opens for its title, chart type, and data binding; add new widgets from a picker of 10+ types — charts render live data while you design.
The report designer
Band-based layout — report header, detail, group and page footers — with text, field, chart, and table elements placed on the canvas and a preview toggle to check the output.
Drill down to the records
Reports built with drilldown enabled let a reviewer click the MRR number and land on the exact subscriptions behind it — permissions applied on the way down.
One dataset feeds them all
The designer binds widgets to datasets, not raw tables — so the dashboard, the report, and an AI answer stay on the same definition of “revenue”.
Governed by design
The report respects the same authority as the app
Because analytics runs inside the runtime, the permission model is not an afterthought — it is the execution path.
Permission-aware results
A regional manager’s dashboard aggregates only their region’s rows; masked fields never leak into a chart or an export.
Same rules for AI and people
AI Ask answers inside the same permissions as every dashboard, so a chat answer never shows more than the screen would.
No export drift
Reports read live objects instead of stale copies, so the number in the meeting is the number in the system.
Decision surface
What changes, who reviews it, what runs
| Business need | AI writes | Runtime supplies |
|---|---|---|
| MRR by plan and month | A dataset with measures and dimensions | Compiled queries, charts, and caching |
| A new KPI card on the ops dashboard | Nothing — click it together in the designer | The widget inspector, live data, saved as metadata |
| Pipeline conversion by stage | A summary report over the stage field | Stage-to-stage computation and trends |
| Ask AI "how did Q3 close?" | Nothing new — the dataset is enough | The same governed numbers, in chat |
Review checklist
An analytics review should confirm
- Key measures are defined once, in datasets, not per chart.
- Dashboards inherit row and field permissions.
- Time series use consistent time zones and calendars.
- AI answers resolve against the same definitions as reports.
- No pipeline exports data to a less-governed copy.
FAQ
Questions this page should answer
Does this replace our BI tool?
For operational reporting on business objects, you will not need a separate stack: dashboards, funnels, and time series run in the platform. For cross-system warehousing, ObjectOS coexists — federation and APIs make governed objects easy to consume.
Are the dashboard and report designers in the open-source ObjectStack?
Yes. The widget-based dashboard designer, the band-based report designer, drilldown, aggregations, time series, funnels, and semantic datasets are all part of the open-source ObjectStack runtime, with the same permission enforcement as the rest of the platform.
Next pages